Showing posts with label downtime. Show all posts

Friday, August 13, 2010

How to Prevent Downtime Due to Human Error

Great post today over at Datacenter Knowledge, citing the fact that "70 percent of the problems that plague data centers" are caused by human error. Below are the best practices to avoid data center failure by human error:

1. Shielding Emergency OFF Buttons – Emergency Power Off (EPO) buttons are generally located near doorways in the data center. Often, these buttons are not covered or labeled, and are mistakenly shut off during an emergency, which shuts down power to the entire data center. Labeling and covering EPO buttons can prevent someone from accidentally pushing the button. See Averting Disaster with the EPO Button and Best Label Ever for an EPO Button for more on this topic.
2. Documented Method of Procedure - A documented step-by-step, task-oriented procedure mitigates or eliminates the risk associated with performing maintenance. Don’t limit the procedure to one vendor, and ensure back-up plans are included in case of unforeseen events.
3. Correct Component Labeling - To correctly and safely operate a power system, all switching devices must be labeled correctly, as well as the facility one-line diagram to ensure correct sequence of operation. Procedures should be in place to double check device labeling.
4. Consistent Operating Practices – Sometimes data center managers get too comfortable and don’t follow procedures, forget or skip steps, or perform the procedure from memory and inadvertently shut down the wrong equipment. It is critical to keep all operational procedures up to date and follow the instructions to operate the system.
5. Ongoing Personnel Training – Ensure all individuals with access to the data center, including IT, emergency, security and facility personnel, have basic knowledge of equipment so that it’s not shut down by mistake.
6. Secure Access Policies – Organizations without data center sign-in policies run the risk of security breaches. Having a sign-in policy that requires an escort for visitors, such as vendors, will enable data center managers to know who is entering and exiting the facility at all times.
7. Enforcing Food/Drinks Policies – Liquids pose the greatest risk for shorting out critical computer components. The best way to communicate your data center’s food/drink policy is to post a sign outside the door that states what the policy is, and how vigorously the policy is enforced.
8. Avoiding Contaminants – Poor indoor air quality can cause unwanted dust particles and debris to enter servers and other IT infrastructure. Much of the problem can be alleviated by having all personnel who access the data center wear antistatic booties, or by placing a mat outside the data center. This includes packing and unpacking equipment outside the data center. Moving equipment inside the data center increases the chances that fibers from boxes and skids will end up in server racks and other IT infrastructure.

Thursday, August 12, 2010

Downtime, downtime, downtime - DNS Made Easy, Posterous, Evernote

It's been a busy week on the interwebs. Either downtime incidents are becoming more common, or I'm just finding out about more of them. One nice thing about this blog is that readers send me downtime events that they come across. I don't know if I want to be the first person that people think of when they see downtime, but I'll take it. In the spirit of this blog, let's take a look at the recent downtime events to see what they did right, what they can improve, and what we can all learn from their experience.


DNS Made Easy
On Saturday August 7th, DNS Made Easy was host to a massive DDoS attack:
"The firm said it experienced 1.5 hours of actual downtime during the attack, which lasted eight hours. Carriers including Level3, GlobalCrossing, Tinet, Tata, and Deutsche Telekom assisted in blocking the attack, which due to its size flooded network backbones with junk."

Prerequisites:
  1. Admit failure - Through a serious of customer email communications and tweets, there was a clear admittance of failure early and often.
  2. Sound like a human - Yes, the communications all sounded genuine and human.
  3. Have a communication channel - Marginal. The communication channels were Twitter and email, which are not as powerful as a health status dashboard.
  4. Above all else, be authentic - Great job here. All of the communication I saw sounded authentic and heartfelt, including the final postmortem. Well done.
Requirements:
  1. Start time and end time of the incident - Yes, final postmortem email communication included the official start and end times (8:00 UTC - 14:00 UTC).
  2. Who/what was impacted - The postmortem addressed this directly, but didn't spell out a completely clear picture of who was affected and who wasn't. This is probably because there isn't a clear distinction between sites that were and weren't affected. To address this, they recommended customers review their DNS query traffic to see how they were affected.
  3. What went wrong - A good amount of detail on this, and I hope there is more coming. DDoS attacks are a great examples of where sharing knowledge and experience help the community as a whole, so I hope to see more detail come out about this.
  4. Lessons learned - The postmortem included some lessons learned, but nothing very specific. I would have liked to see more here.
Bonus:
  1. Details on the technologies involved - Some.
  2. Answers to the Five Why's - Nope.
  3. Human elements - heroic efforts, unfortunate coincidences, effective teamwork, etc - Some.
  4. What others can learn from this experience - Some.
Other notes:
  • The communication throughout the incident was excellent, though they could have benefited from a public dashboard or status blog that went beyond twitter and private customer emails.
  • I don't think this is the right way to address the question of whether SLA credits will be issued: "Yes it will be. With thousands paying companies we obviously do not want every organization to submit an SLA form."

Posterous
"As you’re no doubt aware, Posterous has had a rocky six days.
On Wednesday and Friday, our servers were hit by massive Denial of Service (DoS) attacks. We responded quickly and got back online within an hour, but it didn’t matter; the site went down and our users couldn’t post.
On Friday night, our team worked around the clock to move to new data centers, better capable of handling the onslaught. It wasn’t easy. Throughout the weekend we were fixing issues, optimizing the site, some things going smoothly, others less so.
Just at the moments we thought the worst was behind us, we’d run up against another challenge. It tested not only our technical abilities, but our stamina, patience, and we lost more than a few hairs in the process."
Posterous continued to update their users on their blog, and on twitter. They also sent out an email communication to all of their customers to let everyone know about the issues.

Prerequisites:
  1. Admit failure - Clearly yes, both on the blog and on Twitter.
  2. Sound like a human - Very much so.
  3. Have a communication channel - A combination of blog and Twitter. Again, not ideal, as customers may not think about visiting the blog or checking Twitter. Especially when the blog is inaccessible during the downtime, and they may not be aware of the Twitter account. One of the keys to communication channel is to host if offsite, which would have been important in this case.
  4. Above all else, be authentic - No issues here, well done.
Requirements:
  1. Start time and end time of the incident - A bit vague in the postmortem, but can be calculated from the Twitter communication. Can be improved.
  2. Who/what was impacted - The initial post described this fairly well, that all customers hosted on Posterous.com are affected, including custom domains.
  3. What went wrong - A series of things went wrong in this case, and I believe the issues were described fairly well.
  4. Lessons learned - Much room for improvement here. I don't see any real lessons learned in the postmortem posts or other communications. There were things put in place to avoid the issues int he future, such as moving to a new datacenter and adding hardware, but I don't see any real lessons learned as a result of this downtime.
Bonus:
  1. Details on the technologies involved - Very little.
  2. Answers to the Five Why's - No.
  3. Human elements - Yes, in the final postmortem, well done.
  4. What others can learn from this experience - Not a lot here.
Evernote
From their blog:
"EvernoteEvernote servers. We immediately contacted all affected users via email and our support team walked them through the recovery process. We automatically upgraded all potentially affected users to Evernote Premium (or added a year of Premium to anyone who had already upgraded) because we wanted to make sure that they had access to priority tech support if they needed help recovering their notes and as a partial apology for the inconvenience."
Prerequisites:
  1. Admit failure - Extremely solid, far beyond the bare minimum.
  2. Sound like a human - Yes.
  3. Have a communication channel - A simple health status blog (which according to the comments is not easy to find), a blog, and a Twitter channel. Biggest area of improvement here is to make the status blog easier to find. I have no idea how to get to that from the site or the application, and that defeats its purpose.
  4. Above all else, be authentic - The only communication I saw was the final postmortem, and in that I think in that post (and the comments) they were very authentic.
Requirements:
  1. Start time and end time of the incident - Rough timeframe, would have liked to see more detail.
  2. Who/what was impacted - First time I've seen an exact figure like "6,323" users. Impressive.
  3. What went wrong - Yes, at the end of the postmortem.
  4. Lessons learned - Marginal. A bit vague and hand-wavy. 
Bonus:
  1. Details on the technologies involved - Not bad.
  2. Answers to the Five Why's - No.
  3. Human elements - No.
  4. What others can learn from this experience - Not a lot here.
Conclusion
Overall, I'm impressed with how these companies are handling downtime. Each communicated early and often. Each admitted failure immediately, and kept their users up to date. Each put out a solid postmortem that detailed the key information. It's interesting to see how Twitter is becoming the de-facto communication channel during an incident. I still wonder how effective it is in getting news out to all of your users, and how many users are aware of it. Overall, well done guys.

Update: DNS Made Easy just launched a public health dashboard!

Wednesday, June 30, 2010

Quote in WSJ

Lenny Rachitsky, the head of research and development for the website monitoring company Webmetrics.com, said companies can take advantage of unexpected outages by communicating with customers about what is going on—something Amazon didn't do during the outage, beyond its note to sellers. "Customers don't expect you to be perfect, as long as they feel that they can trust you," he said. "All it takes is to give your users some sense of control."
A similar sentiment was posited by Eric Savitz over at Barrons:
So, here’s the thing: it seems to me that Amazon actually made a bad situation worse by failing to communicate the details of the situation with its customers. My little post Tuesday afternoon on the technical troubles triggered 149 comments, and counting. The company’s customers did not like having the site go down, and even more, they did not like being left in the dark. And so far, the company still has not come clean on what went wrong. Some of the people who commented on my previous post were worried that their personal data might have been compromised. I have no real reason to think that was the case, but it certainly seems odd to me that Amazon has taken what appear to be a defensive and closed-mouth stance on an issue so basic to its customers: the ability to simply use the site. Jeff Bezos, your customers deserve better.

Tuesday, June 29, 2010

Amazon.com goes down, good case study of consumer-facing transparency (or lack thereof)

One of the questions I received from the audience after my talk last week was about how B2C companies should handle downtime and transparency. Today we have a great case study, as Amazon.com was down/degraded for about three hours:
You often hear about Amazon Web Services having some downtime issues, but it’s rare to see Amazon.com itself have major issues. In fact, I can’t ever remember it happening the past couple of years. But that’s very much the case today as for the past couple of hours the service has been switching back and forth between being totally down and being up, but showing no products. (source)


The telling quote, and impression that appears to be prevalent across Twitter and other blogs that have picked up the story is this:
Obviously, Twitter is abuzz about this — though there’s no word from Amazon on Twitter yet about the downtime. Amazon Web Services, meanwhile, all seem to be a go, according to their dashboard. The mobile apps on the iPhone, iPad and Android devices are sort of working, but it doesn’t appear you can go to actual product pages.
Let's think about this from the perspective of the customer. They visit Amazon.com and see this:


They wonder what's going on. They question whether something is wrong with their computer. If they are technical enough they may visit the Amazon's Twitter account to see if there is anything going on (a whole lot of nothing):


Maybe the visitor is even more technical, and knows about the public health dashboard that Amazon offers for their AWS clients. Well, that again gives us the wrong impression (all green lights):


At this point the user is frustrated. She may hop on Twitter and search for something like "amazon down", which would show her that a lot of other people are also having the same problem. This would at least make her feel better. Otherwise she would be stuck, wondering what is going on, how long it'll last, and whether to try shopping someplace else.


It turns out that Amazon did in fact put out an update about what was going on...in the well hidden Amazon services seller forum:


Realistically, Amazon doesn't go down very often, and for most people this is more of an annoyance than anything. I don't see Amazon customers losing trust in Amazon as a result of his incident. As Jesse Robbins put it:

They key here is that now Amazon has a lot less room for error. One more major downtime like this, especially within the year, will begin to eat away at the trust that customers have built for the service. To be proactive in avoiding that problem, and to give themselves more room for error, I would strongly advise Amazon to do the following:
  1. Put some sort of communication out within 24 hours acknowledging the issues.
  2. Put out a detailed postmortem, explaining what happened, and what they are doing to improve for the future.
  3. Improve your process around updating the public about amazon.com downtime. The Twitter account is a good start, and it's very promising that you put out a communication to the public. The problem is that the places your users looked for updates they saw nothing, and the forum you posted to very few users would ever think to check. I would launch a new public health dashboard focused on overall Amazon.com health (and make sure to host this outside of your infrastructure!), which would include the AWS health as a subset (or a simply link), along with other increasingly important elements of your company: Kindle download health, shipping health, etc.
  4. Implement the improvements discussed in the postmortem.

Other takeaways
  1. I'm feeling that transparency in the B2C world is rarely as critical as in B2B relationships. There are certainly cases where consumers are just as inconvenienced and frustrated when their services are down, but in terms of impact and revenue loss, the bar has to be much higher for B2B businesses. I also believe that consumers are much more forgiving of downtime, and won't require as much from a company when they go down. This will change however as consumers become more dependent on the cloud for their everyday lives.
  2. Amazon set the bar high for their AWS transparency. Users of those services automatically checked the existing communication channels, which is what you would want. Unfortunately Amazon did not set up a process to connect those two parts of the company.
  3. This also exposed the problem with having different processes and tools for different parts of your organization. Ideally there would be a central place for status across the entire amazon.com property. It's understandable that AWS is doing things a bit differently, but the consequence as we saw was that users waste time looking at the wrong place. This is something Rackspace has trouble with as well.

Monday, June 28, 2010

Video of my talk (Upside of Downtime) at Velocity 2010

Video of my talk has been posted (below), though watching it and listening to myself feels pretty damn weird. I've been blown away by response I've gotten to this talk. I know of at handful of companies circulating these slides/notes internally and working to make their companies more transparent. I've personally heard from a number of people at the conference that were discussing the ideas with their coworkers thinking about the best approach to take action. Even Facebook (the example I used of how not to handle downtime) has found resonance with the talk, and pointed me to a little known status page.

I'm hoping to start a conversation around the framework and continue to evolve it. I'm going to expand on the ideas in this blog, so if there is anything specific you would like me to explore (e.g. hard ROI, B2C examples, cultural differences, etc), please let me know.

Enjoy the video:


The slides can be found here: http://www.slideshare.net/lennysan/the-upside-of-downtime-velocity-2010-4564992

Wednesday, June 23, 2010

The Upside of Downtime (Velocity 2010)

Here is the full deck from my talk at Velocity, including two bonus sections at the end:
The Upside of Downtime (Velocity 2010)


Also, here is the "Upside of Downtime Framework" cheat-sheet (click through to download):

Tuesday, April 6, 2010

Zendesk - Transparency in action

A colleague pointed me to a simple postmortem written by the CEO of Zendesk, Mikkel Svane:
"Yesterday an unannounced DNS change apparently made our mail server go incognito to the rest of the world. The consequences of this came sneaking over night as the changes propagated through the DNS network. Whammy.

On top of this our upstream internet provider late last night PST (early morning CET) experienced a failure that prevented our servers from reaching external destinations. Web access was not affected but email, widget, targets, basically everything that relied on communication from our servers to the outside world were. Double whammy.

It took too long time to realize that we had two separate issues at hand. We kept focusing on the former as root cause for the latter. And it took unacceptably long to determine that we had a network outage."
How well does such an informal and simple postmortem stack up against the postmortem best practices? Let's find out:

Prerequisites:
  1. Admit failure - Yes, no question.
  2. Sound like a human - Yes, very much so.
  3. Have a communication channel - Yes, both the blog and the Twitter account.
  4. Above all else, be authentic - Yes, extremely authentic.
Requirements:
  1. Start time and end time of the incident - No.
  2. Who/what was impacted - Yes, though more detail would have been nice.
  3. What went wrong - Yes, well done.
  4. Lessons learned - Not much.
Bonus:
  1. Details on the technologies involved - No
  2. Answers to the Five Why's - No
  3. Human elements - Some
  4. What others can learn from this experience - Some
Conclusion:

The meat was definitely there. The biggest missing piece is insight into what lessons were learned and what is being done to improve for the future. Mikkel says that "We've learned an important lesson and will do our best to ensure that no 3rd parties can take us down like this again", but the specifics are lacking. The exact time of the start and end of the event would have been useful as well, for those companies wondering whether this explains their issues that day.

It's always impressive to see the CEO of a company put himself out there like this and admit failure. It is (naively) easier to pretend like everything is OK and hope the downtime blows over. In reality, getting out in front of the problem and being transparent, communicating during the downtime (in this case over Twitter), and after the event is over (in this postmortem), are the best things you can do to turn your disaster into an opportunity to increase customer trust.

As it happens, I will be speaking at the upcoming Velocity 2010 conference about this very topic!

Update: Zendesk has put out a more in-depth review of what happened, which includes everything that was missing from the original post (which as the CEO pointed out in the comments, was meant to be a quick update of what they knew at the time). This new post includes the time frame of the incident, details on what exactly went wrong with the technology, and most importantly lessons and takeaways to improve things for the future. Well done.

Tuesday, March 2, 2010

A guideline for postmortem communication

Building on previous posts, the following is a proposed Guideline for Postmortem Communication:

Prerequisites:
  1. Admit failure - Hiding downtime is no longer an option
  2. Sound like a human - Do not use a standard template, do not apologize for "inconveniencing" us
  3. Have a communication channel - Set up a process to handle incidents prior the event (e.g. public health dashboard, status blog, twitter account, etc.)
  4. Above all else, be authentic - You must be believed to be heard
Requirements:
  1. Start time and end time of the incident
  2. Who/what was impacted - Should I be worried about this incident?
  3. What went wrong - What broke and how you fixed it (with insight into the root cause analysis process)
  4. Lessons learned - What's being done to improve the situation for the future, in technology, process, and communication
Bonus:
  1. Details on the technologies involved
  2. Answers to the Five Why's
  3. Human elements - heroic efforts, unfortunate coincidences, effective teamwork, etc
  4. What others can learn from this experience

Friday, February 19, 2010

As Wordpress goes down, a chance to analyze another postmortem arrises

If you recall, we put together a proposed guideline for postmortem communication in a previous post:

Prerequisites
  1. Admit failure - Hiding downtime is no longer an option (thanks to Twitter)
  2. Sound like a human - Do not use a standard template, do not apologize for "inconveniencing" us.
  3. Have a communication channel - Ideally you've set up a process to handle incidents before the event, and communicated publicly during the event. Customers will need to know where to find your updates.
  4. Above all else, be authentic
Requirements:
  1. Start time and end time of the incident.
  2. Who/what was impacted.
  3. What went wrong, with insight into the root cause analysis process.
  4. What's being done to improve the situation, lessons learned.
Nice-to-have's:
  1. Details on the technologies involved.
  2. Answers to the Five Why's.
  3. Human elements - heroic efforts, unfortunate coincidences, effective teamwork, etc.
  4. What others can learn from this experience.

How did Wordpress do in their
postmortem on 2/19/10?

Prerequisites:
  1. Admit failure: Yes. The very first paragraph makes it clear they screwed up.
  2. Sound like a human: Yes. Extremely personal post.
  3. Have a communication channel: Yes, but not ideal. A combination of their general Twitter account, and the founders blog. Could be improved, but overall OK.
  4. Be authentic: Yes. 110% authentic!
Requirements:
  1. Start/end time: No. Only focused on duration.
  2. Who/what was impacted: Yes. Describes that 10.2 million blogs were affected, for 110 minutes, taking away 5.5 million pageviews.
  3. What went wrong: Yes. Router issues, though investigation is continuing.
  4. Lessons learned: Partial. Mostly a promise to share the results of the investigation.
Nice-to-have's:
  1. Technologies involved: No.
  2. Answers to the Five Why's: No.
  3. Human elements: Yes. "the entire team was on pins and needles trying to get your blogs back as soon as possible"
  4. What others can learn: No.
Conclusion
The intent of the blog was to communicate quickly that they are aware of the severity of the issue and are taking it seriously. The details are lacking, mostly because it was posted so quickly. Still utility of this kind of post is extremely powerful, which makes me wonder if having a pre-postmortem with a simple admittance the issue, with an authentic voice and some detail, is a necessary step in the pre/during/post event communication process.

Wednesday, March 18, 2009

Microsoft showing us how it's done, coming clean about Azure downtime

Following up on yesterdays Windows Azure downtime event, Microsoft posted an excellent explanation of what happened:

The Windows Azure Malfunction This Weekend

First things first: we're sorry. As a result of a malfunction in Windows Azure, many participants in our Community Technology Preview (CTP) experienced degraded service or downtime. Windows Azure storage was unaffected.

In the rest of this post, I'd like to explain what went wrong, who was affected, and what corrections we're making.

What Happened?

During a routine operating system upgrade on Friday (March 13th), the deployment service within Windows Azure began to slow down due to networking issues. This caused a large number of servers to time out and fail.

Once these servers failed, our monitoring system alerted the team. At the same time, the Fabric Controller automatically initiated steps to recover affected applications by moving them to different servers. The Fabric Controller is designed to be very cautious about taking broad recovery steps, so it began recovery a few applications at a time. Because this serial process was taking much too long, we decided to pursue a parallel update process, which successfully restored all applications.

What Was Affected?

Any application running only a single instance went down when its server went down. Very few applications running multiple instances went down, although some were degraded due to one instance being down.

In addition, the ability to perform management tasks from the web portal appeared unavailable for many applications due to the Fabric Controller being backed up with work during the serialized recovery process.

How Will We Prevent This in the Future?

We have learned a lot from this experience. We are addressing the network issues and we will be refining and tuning our recovery algorithm to ensure that it can handle malfunctions quickly and gracefully.

For continued availability during upgrades, we recommend that application owners deploy their application with multiple instances of each role. We'll make two the default in our project templates and samples. We will not count the second instance against quota limits, so CTP participants can feel comfortable running two instances of each application role.

This is a solid template to use in coming clean about your own downtime events. Apologize (in a human, non-boilerplate way), explain what happened, who was affected, and what is being done to prevent this in the future. Well done Microsoft.

Tuesday, March 10, 2009

Monday, February 16, 2009

Media Temple goes down, provides a nice case study for downtime transparency

Earlier today we saw Media Temple experience intermittent downtime over the course of an hour. The first tweet showed up around 8am PST noting the downtime. At 9:06am Media Temple provided a short message confirming the outage:

At ~8:30AM Pacific Time we started experiencing networking issues at our El Segundo Data Center. We are working closely with them to determine the cause of these issues and will report any findings as they become available.

At this time we appear to be back fully. The tardiness of this update is a direct result of these networking issues.

So far, not too bad. Though note the broken rule in hosting your status page in the same location as your service. Lesson #1: Host your status page offsite. Let's keep moving with the timeline....

About the same time the blog post went up, a Twitter message by @mt_monitor pointed to the official status update. Great to see that they actually use Twitter to communicate with their users, and judging by the 360 followers, I think this was a smart way to spread the news. On the other hand, this was the only Twitter update from Media Temple throughout the entire incident, which is strange. And it looks like some users were still in the dark for a bit too long. I was also surprised that the @mediatemple feed made no mention of this. Maybe they have a good reason to keep these separate? Looking at the conversation on Twitter, feels like most people by default use the @mediatemple label. Lesson #2: Don't confuse your users by splitting your Twitter identity.

From this point till about 9:40am PST, users were stuck wondering what was going on:


A few select tweets show us what users were thinking. The conversation on Twitter goes on for about 30 pages, or over 450 tweets from users wondering what the heck was going on.

Finally at 9:40am, Media Temple released their findings:

Our engineers have spoken with the engineers at our El Segundo Data Center (EL-IDC3). Here are their findings:

ASN number 47868 was broadcasting invalid BGP data that caused our routers, and a lot of other routers on the internet, to reboot. This invalid BGP data exploited a software bug in our routers. We have applied filters to prevent us from receiving this invalid data.

At this time they are in contact with their vendors to see if there is a firmware update that will address this. You can expect to see network delays and small outages across the internet as other providers try to address this same issue.

Now that everything is back up and users are "happy", what else can we learn from this experience?

Lessons
  1. Host your status page offsite. (covered above)
  2. Don't confuse your users by splitting your Twitter identity. (covered above)
  3. Some transparency is better then no transparency. The basic status message helped calm people down and reduce support calls.
  4. There was a huge opportunity here for Media Temple to use the tools of social media (e.g. Twitter/Blogging) as a two-way communication channel. Instead, Media Temple used both their blog and Twitter as a broadcast mechanism. I guarantee that if there were just a few more updates throughout the downtime period the tone of the conversation on Twitter would have been much more positive. Moreover, the trust in the service would have been damaged less severely if users were not in the dark for so long.
  5. A health status dashboard would have been very effective in providing information to the public beyond the basic "we are looking into it" status update. Without any work on the part of Media Temple during the event, its users would have been able to better understand the scope of the event, and know instantly whether or not it was still a problem. It would have been extremely powerful when combined with lesson 4, if a representative on Twitter simply pointed users complaining of the downtime to the status page.
  6. The power of Twitter as a mechanism for determining whether a service is down (or whether it is just you), and in spreading news across the world in a matter of minutes, again proves itself.

Thursday, February 12, 2009

An overview of big downtime events over the past year

A relatively good review of the major downtime events in the recent past, with a solid conclusion at the end:
The bigger Web commerce gets, the bigger the opportunities to mess it up become. Outages and downtimes are inevitable; the trick is minimizing the pain they cause.
As we've seen over the past few months, the simplest way to minimize that pain is by letting your customers know what's going on. Before, during, and after. A little transparency goes a long way.

Tuesday, January 20, 2009

Obama takes office...and Facebook/CNN flourish

Some stats from ReadWriteWeb:

In the end, not only did Facebook Connect provide an interactive look into the thoughts and feelings of all those watching CNN's coverage via the web - it did so without crashing. According to the statistics, there were 200,000+ status updates, which equaled out to 3,000 people commenting on the Facebook/CNN feed per minute. Right before Obama spoke, that number grew to 8500. Additionally, Obama's Facebook Fan Page has more than 4 million fans and more than 500,000 wall posts. (We wonder if anyone on his staff will ever read all those!).

CNN didn't do too badly either. They broke their total daily streaming record, set earlier on Election Day, and delivered 5.3 million streams. Did you have trouble catching a stream? We didn't hear of any issues, but if you missed out, you can watch it again later today.
The blogosphere, myself included, often point only at the problems and ignore to times when everything works as expected. This looks to be very much the later. Kudos to Facebook and CNN for putting together such a powerful service, on such a powerful day, without issue.

Update: Spoke too soon :(

Thursday, January 15, 2009

GoDaddy.com down intermittently today. What lessons can we take away?

Though not widely reported, it appears that GoDaddy.com saw some intermittent downtime today:
A distributed denial-of-service attack turned dark at least several thousand Web sites hosted by GoDaddy.com Wednesday morning. The outage was intermittent over several hours, according to Nick Fuller, GoDaddy.com communications manager.

What caught my eye was some insight on how GoDaddy handled the communication during the event:

To add to the consternation of Web site owners, GoDaddy.com's voice mail system pointed to its support page for more information about the outage and when it would be corrected. No such information was posted there.

Luckily this didn't blow up into anything major for GoDaddy, but I'd like to offer up a few suggestions:
  1. If you're pointing your customers to the default support page, make sure to have some kind of call-out link referencing this event. Otherwise customers will be searching through your support forums, getting more frustrated, and end up typing up your support lines (or Twitter'ing their hearts out).
  2. Offer your customers an easy to find public health dashboard (e.g. a link off of the support page). There are numerous benefits that come along with such an offering, but this specific situation would be a perfect use case for one.
  3. Provide a few details on the problem in both the voice mail message, and in whichever online forum you choose to communicate (e.g. health dashboard, blog, twitter, forums, etc.). At the minimum, provide an estimated time to recovery and some details on the scope of the problem.
A little bit of transparency can go a long way. I would venture to say that if any of the above advice was implemented in the future, the customer reaction, and long term benefits, would pay off substantially.

Update: A bit of insight provided by GoDaddy’s Communications Manager Nick Fuller.

Saturday, January 10, 2009

How transparency can help your business

When looking to gain the benefits of transparency (into your downtime and performance issues), you first need to understand the use cases (or more accurately, the user stories) that describe the problems that transparency can solve. It's easy to put something out there looking for the press and marketing benefits. It's a lot more challenging (and beneficial) to understand what transparency can do for your business, and then actually solve those problems.

Transparency user stories

As an end user/customer:
  1. Your service seems to be down. I'd like to know if it's down for anyone else or if it's just me.
  2. I know your service is down, and I want to know when it'll be back up.
  3. I want some kind of explanation of why you went down.
As a business customer using your service as part of my own service offering:
  1. Before betting my business on your service/platform, I need to know how reliable it has been.
  2. My own customers are reporting that my service is down, but everything looks fine on my end. I need to know if your service is down, and if so I need information to keep my customers up to date.
  3. I want to find which link in my ecosystem of external services is broken or slow right away.
  4. One of my customers reported a problem in the past, and I'd like to correlate it with hiccups your service may have had in the past.
  5. I need to know well in advance of any upcoming maintenance windows.
  6. I need to know well in advance if you plan to change any features that are critical to me, or if the performance of the service will change.
As a SaaS provider:
  1. I want my customers (and my prospects) to trust my service. I don't want my customers to lose that trust if I ever go down.
  2. My support department gets flooded with calls and emails during a downtime event.
  3. I want to understand what the uptime and performance of my services are at all times from around the world. Both for internal reasons, and to help my customers diagnose issues they are reporting.
  4. I want to differentiate from my competition based on reliability and customer support.
In the next post, I will dive into ways to attack each of these user stories. Stay tuned.

Thursday, January 8, 2009

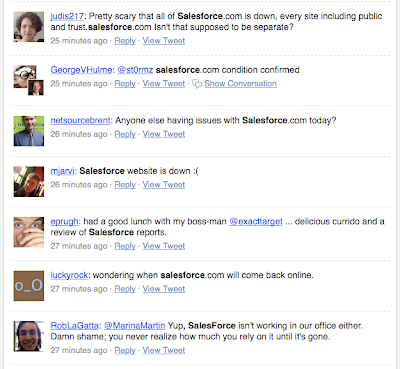
Salesforce.com down for over 30 minutes, and what we can learn from it

See what the blogosphere was saying...and see what more traditional media was saying.

Update: Again, Twitter ends up being the best place to confirm a problem and get updates across the world:

Update 2: Salesforce has posted an explanation of what led to the downtime (
from trust.salesforce.com):
"6:51 pm PST : Service disruption for all instances - resolved
Starting at 20:39 UTC, a core network device failed due to memory allocation errors. The failure caused it to stop passing data but did not properly trigger a graceful fail over to the redundant system as the memory allocation errors where present on the failover system as well. This resulted in a full service failure for all instances. Salesforce.com had to initiate manual recovery steps to bring the service back up.
The manual recovery steps was completed at 21:17 UTC restoring most services except for AP0 and NA3 search indexing. Search of existing data would work but new data would not be indexed for searching.
Emergency maintenance was performed at 23:24 UTC to restore search indexing for AP0 and NA3 and the implementation of a work-around for the memory allocation error.
While we are confident the root cause has been addressed by the work-around the Salesforce.com technology team will continue to work with hardware vendors to fully detail the root cause and identify if further patching or fixes will be needed.
Further updates will be available as the work progresses."

Update 3: Lots of coverage of this event all over the web. All of the coverage focuses on the downtime itself, how unacceptable it is, and bad this makes the cloud look. That's all crap. Everything fails. In-house apps more-so then anything. We can't avoid downtime. What we can avoid is the communication during and after the event, to avoid situations like this:
"Salesforce, the 800-pound gorilla in the software-as-a-service jungle, was unreachable for the better part of an hour, beginning around noon California time. Customers who tried to access their accounts alternately were unable to reach the site at all or received an error message when trying to log in.

Even the company's highly touted public health dashboard was also out of commission. That prompted a flurry of tweets on Twitter from customers wondering if they were the only ones unable to reach the site."

That's where SaaS providers need to focus! Create lines of communication, open the kimono, and let the rays of transparency shine through. It's completely in your control.

Sunday, January 4, 2009

A comprehensive list of SaaS public health dashboards

To anyone looking to build a public health dashboard for their own online service, the following list should give you a head start in understanding what's out there. I also keep an up-to-date list in my delicious account that you can reference at any time. I would suggest reviewing the examples below when coming up with your own design, potentially combining the various approaches to create something truly useful to your customers.

Note: This list is divided up into three tiers. The tiers are determined by a rough combination of company size, service popularity, importance to the general public, and quality of the end result.

Tier One
Tier Two
Tier Three
Non-dashboard system status pages
Don't forget to also review the seven keys to a successful health dashboard, especially since not one public dashboard I've come across meets all of the rules.

Again, the full list can always be found here. If I missed any public dashboards, I'd love to know...simply point to them in the comments and I'll make sure to add them to the list.

Monday, December 22, 2008

Comprehensive review of SaaS SLAs - A sad state of affairs

A recent story about the holes in Google's SLA got me wondering about the state of service level agreements in the SaaS space. The importance of SLA's in the enterprise online world are obvious. I'm sad to report that of the state of the union is not good. Of the handful of major SaaS players, most have no SLAs at all. Of those that do, the coverage is extremely loose, and the penalty for missing the SLAs is weak. To make my point, I've put together an exhaustive (yet pointedly short) list of the SLAs that do exist. I've extracted the key elements and removed the legal mumbo-jumbo (for easy consumption). Enjoy!

Comparing the SLAs of the major SaaS players

Google Apps:
  • What: "web interface will be operational and available for GMail, Google Calendar, Google Talk, Google Docs, and Google Sites"
  • Uptime guarantee: 99.9%
  • Time period: any calendar month
  • Penalty: 3, 7, or 15 days of service at no charge, depending on the monthly uptime percentage
  • Important caveats:
  1. "Downtime" means, for a domain, if there is more than a five percent user error rate. Downtime is measured based on server side error rate.
  2. "Downtime Period" means, for a domain, a period of ten consecutive minutes of Downtime. Intermittent Downtime for a period of less than ten minutes will not be counted towards any Downtime Periods.
Amazon S3:
  • What: Amazon Simple Storage Service
  • Uptime guarantee: 99.9%
  • Time period: "any monthly billing cycle"
  • Penalty: 10-25% of total charges paid by customer for a billing cycle, based on the monthly uptime percentage
  • Important caveats:
  1. “Error Rate” means: (i) the total number of internal server errors returned by Amazon S3 as error status “InternalError” or “ServiceUnavailable” divided by (ii) the total number of requests during that five minute period. We will calculate the Error Rate for each Amazon S3 account as a percentage for each five minute period in the monthly billing cycle. The calculation of the number of internal server errors will not include errors that arise directly or indirectly as a result of any of the Amazon S3 SLA Exclusions (as defined below).
  2. “Monthly Uptime Percentage” is calculated by subtracting from 100% the average of the Error Rates from each five minute period in the monthly billing cycle.
  3. "We will apply any Service Credits only against future Amazon S3 payments otherwise due from you""
Amazon EC2:
  • What: Amazon Elastic Compute Cloud service
  • Uptime guarantee: 99.95%
  • Time period: "the preceding 365 days from the date of an SLA claim"
  • Penalty: "a Service Credit equal to 10% of their bill for the Eligible Credit Period"
  • Important caveats:
  1. “Annual Uptime Percentage” is calculated by subtracting from 100% the percentage of 5 minute periods during the Service Year in which Amazon EC2 was in the state of “Region Unavailable.” If you have been using Amazon EC2 for less than 365 days, your Service Year is still the preceding 365 days but any days prior to your use of the service will be deemed to have had 100% Region Availability. Any downtime occurring prior to a successful Service Credit claim cannot be used for future claims. Annual Uptime Percentage measurements exclude downtime resulting directly or indirectly from any Amazon EC2 SLA Exclusion (defined below).
  2. “Unavailable” means that all of your running instances have no external connectivity during a five minute period and you are unable to launch replacement instances.
...that's it!

Notable
Exceptions (a.k.a. lack of an SLA)
  • Salesforce.com (are you serious??)
  • Google App Engine (youth will only be an excuse for so long)
  • Zoho
  • Quickbase
  • OpenDNS
  • OpenSRS
Conclusions
There's no question that for the enterprise market to get on board with SaaS in any meaningful way accountability is key. Public health dashboards are one piece of the puzzle. SLAs are the other. The longer we delay in demanding these from our key service providers (I'm looking at you Salesforce), the longer and more difficult the move into the cloud will end up being. The incentive in the short term for a not-so-major SaaS player should be to take the initiave and focus on building a strong sense of accountability and trust. As it begins to take business away from the more established (and less trustworthy) services, the bar will rise and customers will begin to demand these vital services from all of their providers. The day's of weak or non-existant SLAs for SaaS providers are numbered.

Disclaimer: If I've misrepresented anything above, or if your SaaS service has a strong SLA, please let us know in the comments. I really hope someone out there is working to raise the bar on this sad state.

Tuesday, December 16, 2008

Google App Engine System Status - A Review

Building off of the rules for a successful public health dashboard, let's see what Google did well, what they can improve, and what questions remain:

Rule #1: Must show the current status for each "service" you offer
  • Considering this is meant to cover only the App Engine service, and not any other Google service, I would say they accomplished their goal. Every API they offer appears to be covered, in addition to the "Serving" metric which appears to test the overall service externally.
  • I appreciate the alphabetic sorting of services, but I would suggest making the "Serving" status a bit more prominent as that would seem to be by far the most important metric.
  • Conclusion: Met!
Rule #2: Data must be accurate and timely
  • Hard to say until an event occurs or we hear feedback about this from users.
  • The announcement does claim the data is an "up-to-the-minute overview of our system status with real-time, unedited data." If this is true, this is excellent news.
  • The fact that an "Investigating" status is an option tells me that the status may not always be real-time or unedited. Or I may just be a bit too paranoid :)
  • In addition the fact that "No issues" and "Minor performance issues" are both considered healthy tells us that issues Google considers "minor" will be ignored or non-transparent. That's bad news. Though it does fit with their SLA questions that came up recently.
  • Conclusion: Time will tell (but promising)
Rule #3: Must be easy to find
  • If I were experiencing a problem with App Engine, I would first go to the homepage here. Unfortunately I don't see any link to the system status page. A user would either have to stumble upon the blog post announcing this page, or work through the forum...defeating the purpose of the system status page!
  • The URL to the system status (http://code.google.com/status/appengine/) page is not easy to remember. Since Google doesn't seem to own appengine.com, this is may not be easy to fix, but that doesn't matter to a user that's in the middle of an emergency and needs to figure out what's going on. The good news is that at the time of this writing, a Google search for "google app engine status" has the status page as the third result, and I would think that it will raise to #1 very soon.
  • Conclusion: Not met (but easy to fix by adding a link from the App Engine homepage).
Rule #4: Must provide details for events in real time
  • Again, hard to say until we see an issue occur.
  • What I'm most interested in is how much detail they provide when an event does occur, and whether they send users over to the forums or to the blog, or simply provide the information on the status page.
  • Conclusion: Time will tell.
Rule #5: Provide historical uptime and performance data
  • Great job with this. I dare say they've jumped head of every other cloud service in the amount and detail on performance data they provide.
  • Still unclear how much historical data will be maintained, but even 7 days is enough to satisfy me.
  • Conclusion: Met!
Rule #6: Provide a way to be notified of status changes
Rule #7: Provide details on how the data is gathered
  • Beyond the mention that they are "using some of the same raw monitoring data that our engineering team uses internally", no real information on how this data is collected, how often it is updated, or where the monitoring happens from.
  • Conclusion: Not met.
Overall, in spite of more rules being missed than met, the more difficult requirements are looking great, and the pieces are in place to create a very complete and extremely useful central place for their customers to come in time of need. I'm excited to see where Google takes this dashboard from here, and how other cloud services respond to this ever growing need.