Friday, August 13, 2010

How to Prevent Downtime Due to Human Error

Great post today over at Datacenter Knowledge, citing the fact that "70 percent of the problems that plague data centers" are caused by human error. Below are the best practices to avoid data center failure by human error:

1. Shielding Emergency OFF Buttons – Emergency Power Off (EPO) buttons are generally located near doorways in the data center. Often, these buttons are not covered or labeled, and are mistakenly shut off during an emergency, which shuts down power to the entire data center. Labeling and covering EPO buttons can prevent someone from accidentally pushing the button. See Averting Disaster with the EPO Button and Best Label Ever for an EPO Button for more on this topic.
2. Documented Method of Procedure - A documented step-by-step, task-oriented procedure mitigates or eliminates the risk associated with performing maintenance. Don’t limit the procedure to one vendor, and ensure back-up plans are included in case of unforeseen events.
3. Correct Component Labeling - To correctly and safely operate a power system, all switching devices must be labeled correctly, as well as the facility one-line diagram to ensure correct sequence of operation. Procedures should be in place to double check device labeling.
4. Consistent Operating Practices – Sometimes data center managers get too comfortable and don’t follow procedures, forget or skip steps, or perform the procedure from memory and inadvertently shut down the wrong equipment. It is critical to keep all operational procedures up to date and follow the instructions to operate the system.
5. Ongoing Personnel Training – Ensure all individuals with access to the data center, including IT, emergency, security and facility personnel, have basic knowledge of equipment so that it’s not shut down by mistake.
6. Secure Access Policies – Organizations without data center sign-in policies run the risk of security breaches. Having a sign-in policy that requires an escort for visitors, such as vendors, will enable data center managers to know who is entering and exiting the facility at all times.
7. Enforcing Food/Drinks Policies – Liquids pose the greatest risk for shorting out critical computer components. The best way to communicate your data center’s food/drink policy is to post a sign outside the door that states what the policy is, and how vigorously the policy is enforced.
8. Avoiding Contaminants – Poor indoor air quality can cause unwanted dust particles and debris to enter servers and other IT infrastructure. Much of the problem can be alleviated by having all personnel who access the data center wear antistatic booties, or by placing a mat outside the data center. This includes packing and unpacking equipment outside the data center. Moving equipment inside the data center increases the chances that fibers from boxes and skids will end up in server racks and other IT infrastructure.

Thursday, August 12, 2010

Downtime, downtime, downtime - DNS Made Easy, Posterous, Evernote

It's been a busy week on the interwebs. Either downtime incidents are becoming more common, or I'm just finding out about more of them. One nice thing about this blog is that readers send me downtime events that they come across. I don't know if I want to be the first person that people think of when they see downtime, but I'll take it. In the spirit of this blog, let's take a look at the recent downtime events to see what they did right, what they can improve, and what we can all learn from their experience.


DNS Made Easy
On Saturday August 7th, DNS Made Easy was host to a massive DDoS attack:
"The firm said it experienced 1.5 hours of actual downtime during the attack, which lasted eight hours. Carriers including Level3, GlobalCrossing, Tinet, Tata, and Deutsche Telekom assisted in blocking the attack, which due to its size flooded network backbones with junk."

Prerequisites:
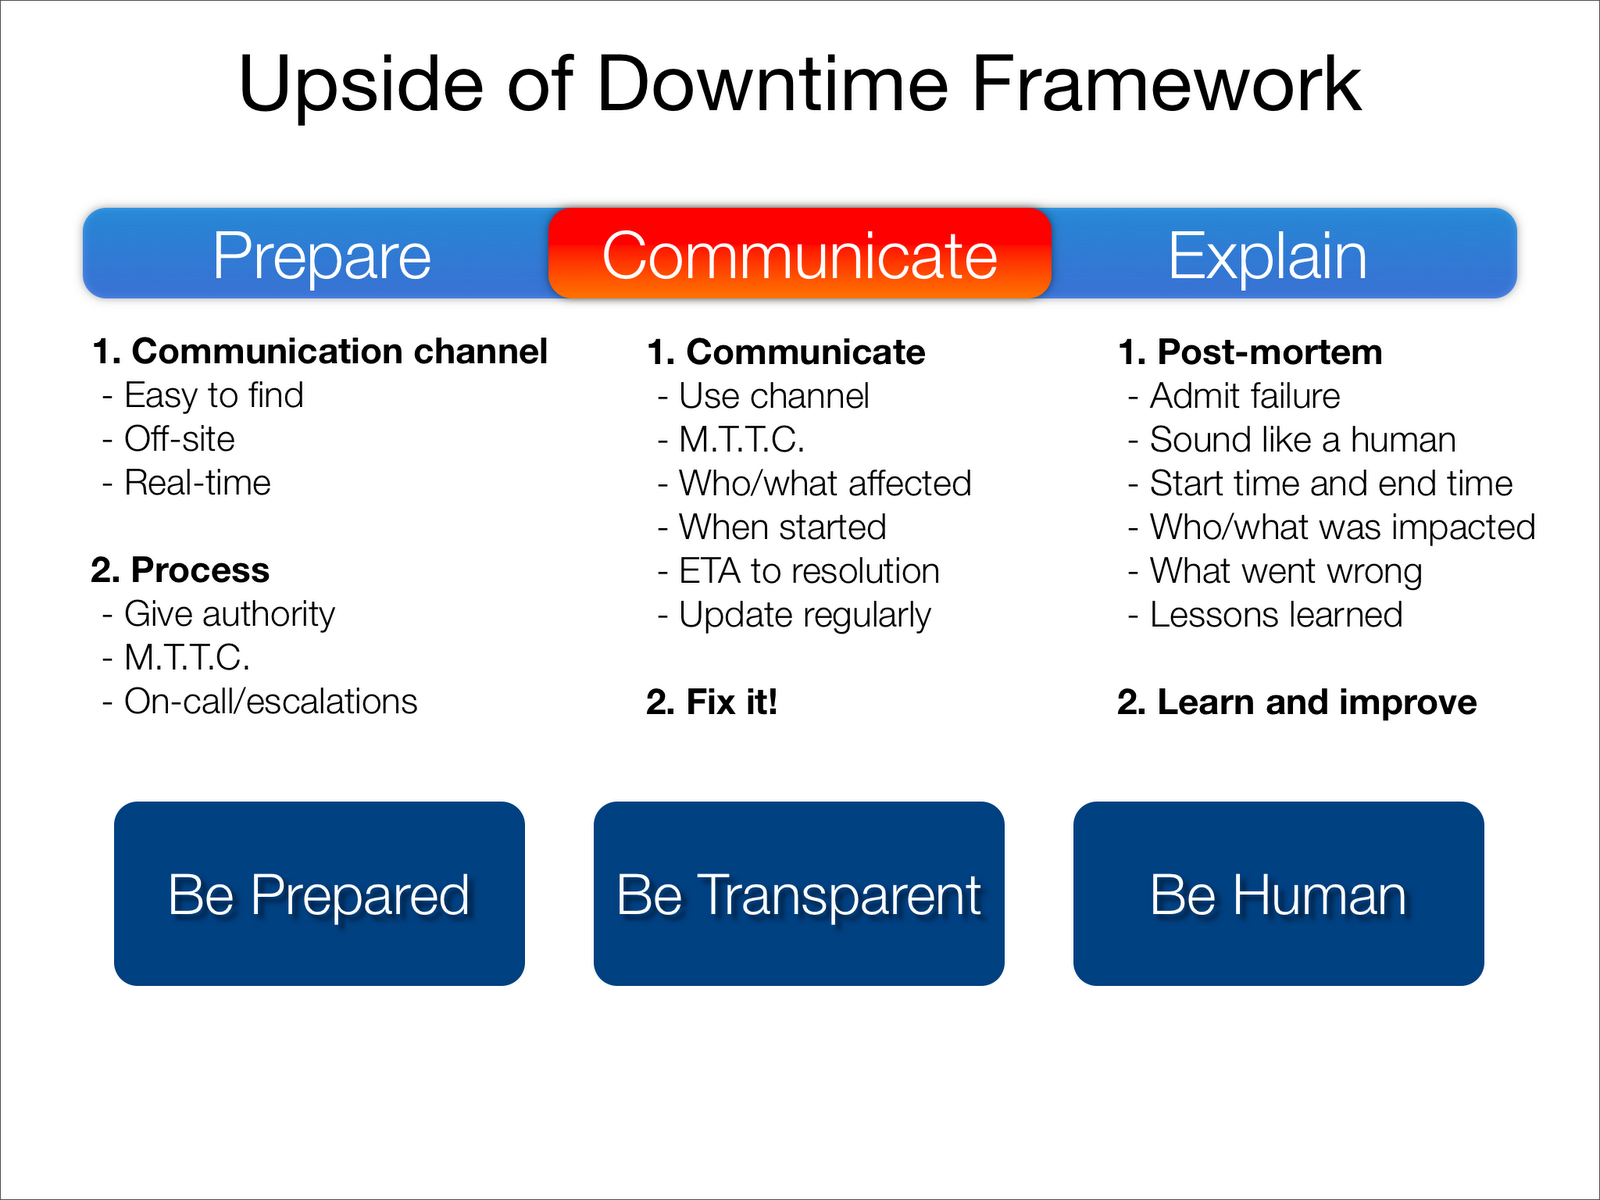
  1. Admit failure - Through a serious of customer email communications and tweets, there was a clear admittance of failure early and often.
  2. Sound like a human - Yes, the communications all sounded genuine and human.
  3. Have a communication channel - Marginal. The communication channels were Twitter and email, which are not as powerful as a health status dashboard.
  4. Above all else, be authentic - Great job here. All of the communication I saw sounded authentic and heartfelt, including the final postmortem. Well done.
Requirements:
  1. Start time and end time of the incident - Yes, final postmortem email communication included the official start and end times (8:00 UTC - 14:00 UTC).
  2. Who/what was impacted - The postmortem addressed this directly, but didn't spell out a completely clear picture of who was affected and who wasn't. This is probably because there isn't a clear distinction between sites that were and weren't affected. To address this, they recommended customers review their DNS query traffic to see how they were affected.
  3. What went wrong - A good amount of detail on this, and I hope there is more coming. DDoS attacks are a great examples of where sharing knowledge and experience help the community as a whole, so I hope to see more detail come out about this.
  4. Lessons learned - The postmortem included some lessons learned, but nothing very specific. I would have liked to see more here.
Bonus:
  1. Details on the technologies involved - Some.
  2. Answers to the Five Why's - Nope.
  3. Human elements - heroic efforts, unfortunate coincidences, effective teamwork, etc - Some.
  4. What others can learn from this experience - Some.
Other notes:
  • The communication throughout the incident was excellent, though they could have benefited from a public dashboard or status blog that went beyond twitter and private customer emails.
  • I don't think this is the right way to address the question of whether SLA credits will be issued: "Yes it will be. With thousands paying companies we obviously do not want every organization to submit an SLA form."

Posterous
"As you’re no doubt aware, Posterous has had a rocky six days.
On Wednesday and Friday, our servers were hit by massive Denial of Service (DoS) attacks. We responded quickly and got back online within an hour, but it didn’t matter; the site went down and our users couldn’t post.
On Friday night, our team worked around the clock to move to new data centers, better capable of handling the onslaught. It wasn’t easy. Throughout the weekend we were fixing issues, optimizing the site, some things going smoothly, others less so.
Just at the moments we thought the worst was behind us, we’d run up against another challenge. It tested not only our technical abilities, but our stamina, patience, and we lost more than a few hairs in the process."
Posterous continued to update their users on their blog, and on twitter. They also sent out an email communication to all of their customers to let everyone know about the issues.

Prerequisites:
  1. Admit failure - Clearly yes, both on the blog and on Twitter.
  2. Sound like a human - Very much so.
  3. Have a communication channel - A combination of blog and Twitter. Again, not ideal, as customers may not think about visiting the blog or checking Twitter. Especially when the blog is inaccessible during the downtime, and they may not be aware of the Twitter account. One of the keys to communication channel is to host if offsite, which would have been important in this case.
  4. Above all else, be authentic - No issues here, well done.
Requirements:
  1. Start time and end time of the incident - A bit vague in the postmortem, but can be calculated from the Twitter communication. Can be improved.
  2. Who/what was impacted - The initial post described this fairly well, that all customers hosted on Posterous.com are affected, including custom domains.
  3. What went wrong - A series of things went wrong in this case, and I believe the issues were described fairly well.
  4. Lessons learned - Much room for improvement here. I don't see any real lessons learned in the postmortem posts or other communications. There were things put in place to avoid the issues int he future, such as moving to a new datacenter and adding hardware, but I don't see any real lessons learned as a result of this downtime.
Bonus:
  1. Details on the technologies involved - Very little.
  2. Answers to the Five Why's - No.
  3. Human elements - Yes, in the final postmortem, well done.
  4. What others can learn from this experience - Not a lot here.
Evernote
From their blog:
"EvernoteEvernote servers. We immediately contacted all affected users via email and our support team walked them through the recovery process. We automatically upgraded all potentially affected users to Evernote Premium (or added a year of Premium to anyone who had already upgraded) because we wanted to make sure that they had access to priority tech support if they needed help recovering their notes and as a partial apology for the inconvenience."
Prerequisites:
  1. Admit failure - Extremely solid, far beyond the bare minimum.
  2. Sound like a human - Yes.
  3. Have a communication channel - A simple health status blog (which according to the comments is not easy to find), a blog, and a Twitter channel. Biggest area of improvement here is to make the status blog easier to find. I have no idea how to get to that from the site or the application, and that defeats its purpose.
  4. Above all else, be authentic - The only communication I saw was the final postmortem, and in that I think in that post (and the comments) they were very authentic.
Requirements:
  1. Start time and end time of the incident - Rough timeframe, would have liked to see more detail.
  2. Who/what was impacted - First time I've seen an exact figure like "6,323" users. Impressive.
  3. What went wrong - Yes, at the end of the postmortem.
  4. Lessons learned - Marginal. A bit vague and hand-wavy. 
Bonus:
  1. Details on the technologies involved - Not bad.
  2. Answers to the Five Why's - No.
  3. Human elements - No.
  4. What others can learn from this experience - Not a lot here.
Conclusion
Overall, I'm impressed with how these companies are handling downtime. Each communicated early and often. Each admitted failure immediately, and kept their users up to date. Each put out a solid postmortem that detailed the key information. It's interesting to see how Twitter is becoming the de-facto communication channel during an incident. I still wonder how effective it is in getting news out to all of your users, and how many users are aware of it. Overall, well done guys.

Update: DNS Made Easy just launched a public health dashboard!

Tuesday, August 10, 2010

Transparency in action at Twilio

When Twilio launched an open-source public health dashboard tool a couple of weeks ago, I knew I had to learn more about Twilio. I connected with John Britton (Developer Evangelist at Twilio) to get some insight into the Twilio's transparency story. Enjoy...

Q. What motivated Twilio to launch a public health dashboard and to put resources into transparency?
Twilio's goal is to bring the simplicity and transparency common in the world of web technologies to the opaque world of telephony and communications.  Just as Amazon AWS and other web infrastructure providers give customers direct and immediate information on service availability, Stashboard allows Twilio to provide a dedicated status portal that our customers can visit anytime to get up-to-the-minute information on system heath.  During the development of Stashboard, we realized how many other companies and businesses could use a simple, scalable status page, so we open sourced it!  You can download the source code or fork your own version.

Q. What roadblocks did you encounter on the way to launching the public dashboard, and how did you overcome them?
The most difficult part of building and launching Stashboard was creating a robust set of APIs that would encompass Twilio's services as well as other services from companies interested in running an instance of Stashboard themselves. We looked at existing status dashboards for inspiration, including the Amazon AWS Status Page and the Google Apps Status Page, and settled on a very general design independent from Twilio's product. The result is a dashboard that can be utilized to track a variety of APIs and services.  For example, a few days after the release of Stashboard, MongoHQ, a hosted MongoDB database provider launched their own instance of Stashboard to give their customers API status information.

Q. What benefits have you seen as a result of your transparency initiatives?
Twilio's rapid growth is a great example of how developers at both small and large companies have responded to Twilio's simple open approach.  The Twilio developer community has grown to more then 15,000 strong and we see more and more applications and developers on the platform everyday.  Twilio was founded by developers who have a strong background in web services and distributed systems.  This is reflected in our adoption of open standards like HTTP and operational transparency with services like http://status.twilio.com.  Another example is the community that has grown up around OpenVBX, a downloadable phone system for small business Twilio developed and open sourced a few week ago.   We opened OpenVBX to provide developers the simplest way to hack, skin, and integrate it with their own systems.

Q. What is your hope with the open source dashboard framework?
The main goal of Stashboard is to give back to the community.  We use open source software extensively inside Twilio and we hope that by opening up Stashboard it will help other hosted services and improve the whole web services ecosystem.

Q. What would you say to companies considering transparency in their uptime/performance?
Openness and transparency are key to building trust with customers.  Take the telecom industry as an example.  They are known for being completely closed.  Customers rarely love or trust their telecom providers.   In contrast, Twilio brings the open approach of the web to telecom and the response has been truly amazing.  When customers know they can depend on a company to provide accurate data concerning performance and reliability, they are more willing give that company their business and recommend it to their peers.  Twilio's commitment to transparency and openness has been a huge driver of our success and Stashboard and projects like OpenVBX are just the beginning.

Wednesday, July 28, 2010

Transparency in action at OpenSRS

OpenSRS has long been a company that "gets it", so I was excited to have the opportunity to interview Ken Schafer, who leads the transparency efforts at OpenSRS and Tucows. OpenSRS has an excellent public health dashboard, and continues to put a lot of effort into transparency. Heather Leson, who works with Ken, has done a lot to raise the bar in the online transparency community. My hope is that the more transparent we all get about our own transparency efforts (too much?) the more we all benefit. Below, Ken tells us how he got the company to accept the need for transparency, what hurdles they had to overcome, and what benefits they've seen. Enjoy the interview, and if you have any questions for Ken, please post them as comments below.

Q. Can you briefly explain your role and how you got involved in your company’s transparency initiative?
My formal title is Executive Vice President of Product & Marketing.  That means I'm on the overall Tucows exec team and I'm also responsible for the product strategy and marketing of OpenSRS, our wholesale Internet services group.

Tucows is one of the original Internet companies - founded in 1993. We've moved well beyond the original software download site and now the company makes most of its money providing easy-to-use Internet services.

OpenSRS provides end users with over 10 million domain names, millions of mailboxes, and tens of thousands of digital certificates through over 10,000 resellers in over 100 countries. Our resellers are primarily web hosts, ISPs, web developers and designers, and IT consultants.

Q. What has your group done to create transparency for your organization?
Given the technical adeptness of our resellers we've always tried not to talk down to them and to provide as much information as we can. Our success and the success of our resellers are highly dependent on each other so we're very open to sharing and in fact since the beginning of OpenSRS in 1999 we've run mailing lists, blogs, forums, wiki, status pages and a host of other ways for us to communicate better with our resellers.

Transparency is kind of in the nature of the business at this point.

Right now we provide transparency into what we're doing through a blog, a reseller forum, our Status site and our activity on a host of social networks.

Q. What was the biggest hurdle you had to get over to push this through?
The biggest challenge is really whether your commitment to transparency can survive the bad times. Being transparent when you've got a status board full of green tick marks isn't that hard. When everything starts turning red and staying that way, THAT'S a lot harder.

We're generally proud of our uptime and the quality of our services but a few years ago we struggled with scaling some of our applications and, frankly, our communication around the problems we were facing suffered as a result. People here were just too embarrassed to tell our resellers that we'd messed stuff up and in particular to admit to our fellow geeks HOW we'd messed up.

But when we pushed and DID share information and admitted our mistakes and talked about what we could do to make it better what we found was that our resellers were appreciative AND very sympathetic. They'd all been there too and knew it was hard to fess up to our errors in judgment and they really appreciated it.

One thing we STILL struggle with is how we communicate around network attacks. Our services run a big chunk of the Internet and as such we're under pretty much constant attack of one sort or another. We handle most of these without anyone noticing. Our operations and security teams do an amazing job of keeping things running smoothly in the face of these attacks but every once in a while something new - in scope, scale or technique - happens that puts pressure on our systems until we can adjust to the new threat.

In those cases we've tended to put our desire for transparency aside and give minimal information so as not to show our hand to the bad guys. It's a struggle between what we share so customers understand what is happening and not showing potential vulnerabilities that others could exploit.

I guess "sharing what is exploitable" is where I draw the line when it comes to transparency.

Q. What benefits have you seen as a result of your transparency?
One of the biggest benefits is in the overall quality of the service. When you say that EVERY problem is going to get publicly and permanently posted to a status page it REALLY focusses the organization on quality of service!

Q. Can you give us some insight into the processes around your transparency? Specifically who manages the communication, who is responsible for maintaining the dashboard, and what the general process looks like before/during/after a big event.
Our communications team (Marketing) is responsible for the OpenSRS Status page.  We generally hire marketers that are technically comfortable so they can write to be understood and understand what they're writing about.

We have someone from Marketing on call 24/7/365 and whenever an issue cannot be resolved in an agreed-to period of time (generally 15 minutes) our Network Operations Center (also 24/7/365) informs Marketing and we post to Status.

Our Status page is a heavily customized version of Wordpress plus an email notification system and auto-updates to our Twitter feed.

Marketing and NOC then stay in touch until the issue is resolved, posting updates as material changes occur or at two hour intervals if the issue is ongoing.

You'll notice this is a largely manual system. We decided against posting our internal monitoring tools publicly because of the complexity of our operations. Multiple services each composed of multiple sub-systems running in data centers around the word mean that the raw data isn't as useful to resellers as it may be for some less complex environments.

In the event of a serious problem we also have an escalation process - once again managed by Marketing - that brings in additional levels of communications and executives. For major issues we also have a "War Room" procedure that is put in place until the issue is resolved.

Q. What would you say to other organizations that are considering transparency as a strategic initiative?
The days of hiding are over. You now have a choice of whether you want to tell the story or have others misrepresent the story on your behalf. It seems scary to admit you have problems but you gain so much by being open and honest that the stress of taking a new approach to communications is easily outweighed.

Tuesday, July 27, 2010

I'm doing an O'Reilly Webcast this Thursday!


The folks at O'Reilly asked me to do a webcast of my talk, and I was happy to oblige. This talk will be very similar to the one I did at Velocity. I don't think I'll be doing this talk for much longer, so this may be your last chance to hear it live. I'd love to have you there and to hear any feedback you may have about the message. The webcast will begin at 10am PST this coming Thursday, and you can register here.

Tuesday, July 20, 2010

Why Transparency Works

We've talked about the benefits of transparency. We've talked about implementing transparency. We've talked about transparency in action. What we haven't yet talked about is...why the heck does transparency work? Why does transparency make your users happier? Why do customers trust you more when you are transparent? Why do we want to know what's going on? What allows us to be OK with major problems by simply knowing what is going on? My theory is simple: Transparency gives us a sense of control, and control is required for happiness. Allow me to elaborate.

Downtime and learned helplessness
The concept of learned helplessness was developed in the 1960s and 1970s by Martin Seligman at the University of Pennsylvania. He found that animals receiving electric shocks, which they had no ability to prevent or avoid, were unable to act in subsequent situations where avoidance or escape was possible. Extending the ramifications of these findings to humans, Seligman and his colleagues found that human motivation [...] is undermined by a lack of control over one's surroundings. (source)
Learned helplessness was discovered by accident when Seligman was researching Pavlovian conditioning. His experiment was set up to associate a tone with a (harmless) shock, to test whether the animal would learn to run away from just the sound of the tone. In the now famous experiment, one group of dogs was restrained and unable to escape the shock for a period of time (i.e. this group had no control over its situation). Later this group was placed into an area that now allowed them to escape the shock; unexpectedly the dogs stayed put. The shocks continued to come, yet the dogs simply curled up in the corner and whimpered. These dogs exhibited depression, and in a sense gave up on life, because these negative events were seemingly random. Seligman concluded that "the strongest predictor of a depressive response was lack of control over the negative stimulus." What is downtime if not a lack of control over a negative stimulus?


The Cloud and loss of control
Many concerns come up when businesses consider the cloud, but as the survey by IDC below shows the overriding concern is rooted in a loss of control:

You give up a lot of control in exchange for reduced cost, higher efficiency, and increased flexibility. Yet that that desire for control persists, and the remaining bits of control you maintain become even more valuable.

Downtime kills our sense of control
Downtime is quite simply a negative event over which you have almost no control. Especially when using SaaS/cloud services your remaining semblance of control vanishes as soon as service goes down and you have no insight into what is going on. We are the dogs trapped in the shock machine, whimpering in the corner.


As I described in my talk, downtime is inevitable. Thanks to things like risk homeostasis, black swan events, unknown unknowns, and our own nature, there is no way to avoid failure. All we can do is prepare for it, and communicate/explain what is going on. And that is the key to keeping us from the fate of a depressed canine. Transparency gives us a sense of control over the uncontrollable.

How transparency gives us back the sense of control
Imagine walking through the park, the sun shining, the birds singing. All of a sudden you notice a strong pain in your arm. Your mind jumps to the worst. Are you having a heart attack, did something just bite you, are you getting older and sicker? Then a split second later you remember...your buddy jokingly punched you earlier in the day! The punch must have been harder than you remember, but it explains the pain. Instantly you feel better. Though the pain is the same, you understand the source. You have an explanation for the pain. Transparency delivers that explanation.

When Amazon goes down, or Gmail isn't loading, users feel pain. Part of that pain comes from the inconvenience of not being able to do what you want to get done, or the lost revenue that comes with downtime. But just as painful is the sense of fatalistic helplessness, especially if someone is breathing down your neck expecting you to fix the problem. Without insight into what is happening with the service, you are completely without control. If on the other hand the service provides an explanation, through a public health dashboard or a status blog or a simple tweet, your fatalistic reaction turns to concrete concern. Your mind goes from assuming the worst (e.g. this service is terrible, they don't know what they are doing, it always fails) to focusing on a real and specific problem (e.g. some hard drive in the datacenter failed, they had some user error, this'll be gone soon). A specific problem is fixable, an unexplained pain is not. Transparency brings the pain down to a specific and knowable problem, while also holding the provider accountable for their issues (which indirectly gives you even more control). Or better said:
Seligman believes it is possible to change people's explanatory styles to replace learned helplessness with "learned optimism." To combat (or even prevent) learned helplessness in both adults and children, he has successfully used techniques similar to those used in cognitive therapy with persons suffering from depression. These include identifying negative interpretations of events, evaluating their accuracy, generating more accurate interpretations, and decatastrophizing (countering the tendency to imagine the worst possible consequences for an event). (source)
By providing a sense of control, transparency is one of the keys to keeping us happy, productive, and sane in an increasingly uncontrollable world.

Thursday, July 8, 2010

Facebook and transparency

As some of you may know, I use Facebook as an example of how not-to-do-transparency in my talk. Immediately following my talk at Velocity, I received the following comment from Bret Taylor (CTO of Facebook):


The
"Platform Live Status" page that is mentioned is such:


There's some really good stuff here (e.g. it exists, it looks up-to-date, and it has some great features). There is also a lot of room for improvement. Putting aside the fact that this wasn't meant to be a fully-featured dashboard, and is far better then nothing, lets run their status page through the
rules for a successful public health dashboard and see what we can advise for the next evolution of Facebook's transparency initiative:

Rule #1: Must show the current status for each "service" you offer
Today the status page only gives the status of various services through plain text. For example, at the time of this writing, the "hello, active and total user counts are currently missing from both public profile pages and the API." The two graphs to the right show API response time and error rate across all API functions, not per-API or per-function area. Showing a graph and/or status light for each API/function would add tremendous value for developers that use specific parts of the application and only need to know about those specific areas. It would also make it easier to automate functionality, and to decide which components can be relied on in your architecture.

Recommendation: A graph and status light for each specific API function and end-point that developers may use. See Google's health dashboard for ideas.

Rule #2: Data must be accurate and timely
From the outside this appears to be solid. My big worry is that updates are currently very manual, which isn't going to scale. I haven't watched the site long enough to gauge how timely the updates are, but let's give them the benefit of the doubt. The main reason for this rule, requiring that your data be accurate and timely, comes down to trust. If your users get a hint of inaccuracy or delays in updates, they lose faith in the tool and stop using it. Your users will resort back to emailing/tweeting/complaining, which defeats the entire purpose.

Recommendation: Automate status updates as much as possible. Set up regular monitoring that posts status changes automatically. Create a formal process that requires someone to post a detailed update within a Minimum-Time-To-Communicate.

Rule #3: Must be easy to find
This may be the biggest problem today with Facebook's status page. I've been collecting public heath blogs/dashboards for a couple years now, and I've never come across it. Google'ing for "facebook uptime" or "facebook status" does not help. There are over 100 links to the page, but most are from deep within developer forums. If Facebook is serious about using transparency to their advantage, this page needs to be linked to from the first place that developers would go when they experience issues with the API.

Recommendation: Link to the status page from here and here. Not being a Facebook developer, I'm not the best judge of this, but I'm sure Facebook has plenty of data to figure this out.

Rule #4: Must provide details for events in real time
We discussed this already, but it's very important, especially for API-based developers. The error rate graph is very useful for this, which appears to be real-time. I would do more with it.

Recommendations: Show error rate per API/function (including the types of issues seen), and show historical information to give an impression of what's "normal". Developer mostly need to know who is at fault. If you simply let them know that something is up on your end, they'll feel a lot better and be able to go on with their day. See trust.salesforce.com for an easy way so integrate basic updates into dashboard (click on an error icon).

Rule #5: Provide historical uptime and performance data
Mostly lacking in this area. The graphs only go back to the start of the current day, and the text status-updates go back about 2 weeks. A historical perspective gives new developers a baseline to go by, and gives existing developers a chance to correlate issues they saw on their end.

Recommendation: See OpenSRS's dashboard for a simple way to do historical uptime/performance by service/API. Clicking on the "archive" link shows you past updates for every service.

Rule #6: Provide a way to be notified of status changes
Facebook is actually doing a great job here. They have both an RSS feed and an email option, which is extremely rare and extremely awesome. This allows developers to be pushed updates, and to integrate the updates into your internal dashboards. Great job here.

Recommendations: None!

Rule #7: Provide details on how the data is gathered
Currently customers have no insight into how the API response/errors are measured, and what the policy around status updates is. Is it ad-hoc, is it comprehensive, is it automated? It's hard to rely on this data today without insight into those policies and processes.

Recommendation: Add an explanation to the bottom of the page, or as a link off of the page, going into some of these details. You don't have to reveal your special sauce, just give us confidence that we can rely on this data.

Bonus
  1. The list of top bugs along the left side is a GREAT idea. This takes transparency to another level, and I would highly encourage other sites to adopt this practice. Developers are the target audience for both health issue and outstanding bugs, so why not combine them (along with the "Developer Updates" feed) into a single dashboard ? Brilliant.
  2. I like how the "Current Status" is broken out into a big yellow box at the top, making it clear what the situation is right now. This is much better than the default approach of showing the latest status as simply the top news item in the chronological list. A nice touch.
Conclusion
The most important takeaway is that Facebook has taken the hardest step toward transparency: getting a status blog/dashboard online. If they were to implement some of the recommendations above, they would see more of the benefits that come with transparency, and set a great example for other development platforms.