Tuesday, April 13, 2010

Atlassian has security breach, responds with transparency, sees benefits

This past Sunday, Atlassian (makers of Confluence, JIRA, and other popular collaboration tools), experienced a security breach:
Around 9pm U.S. PST Sunday evening, Atlassian detected a security breach on one of our internal systems. The breach potentially exposed passwords for customers who purchased Atlassian products before July 2008. During July 2008, we migrated our customer database into Atlassian Crowd, our identity management product, and all customer passwords were encrypted. However, the old database table was not taken offline or deleted, and it is this database table that we believe could have been exposed during the breach.
Instead of keeping the break-in private, and hoping for the incident to blow over quickly, they emailed their entire customer base the very next day with the gory details:


It turned out that this email alarmed a number of customers who had to no reason to worry (as their accounts were unaffected), which led to another email:


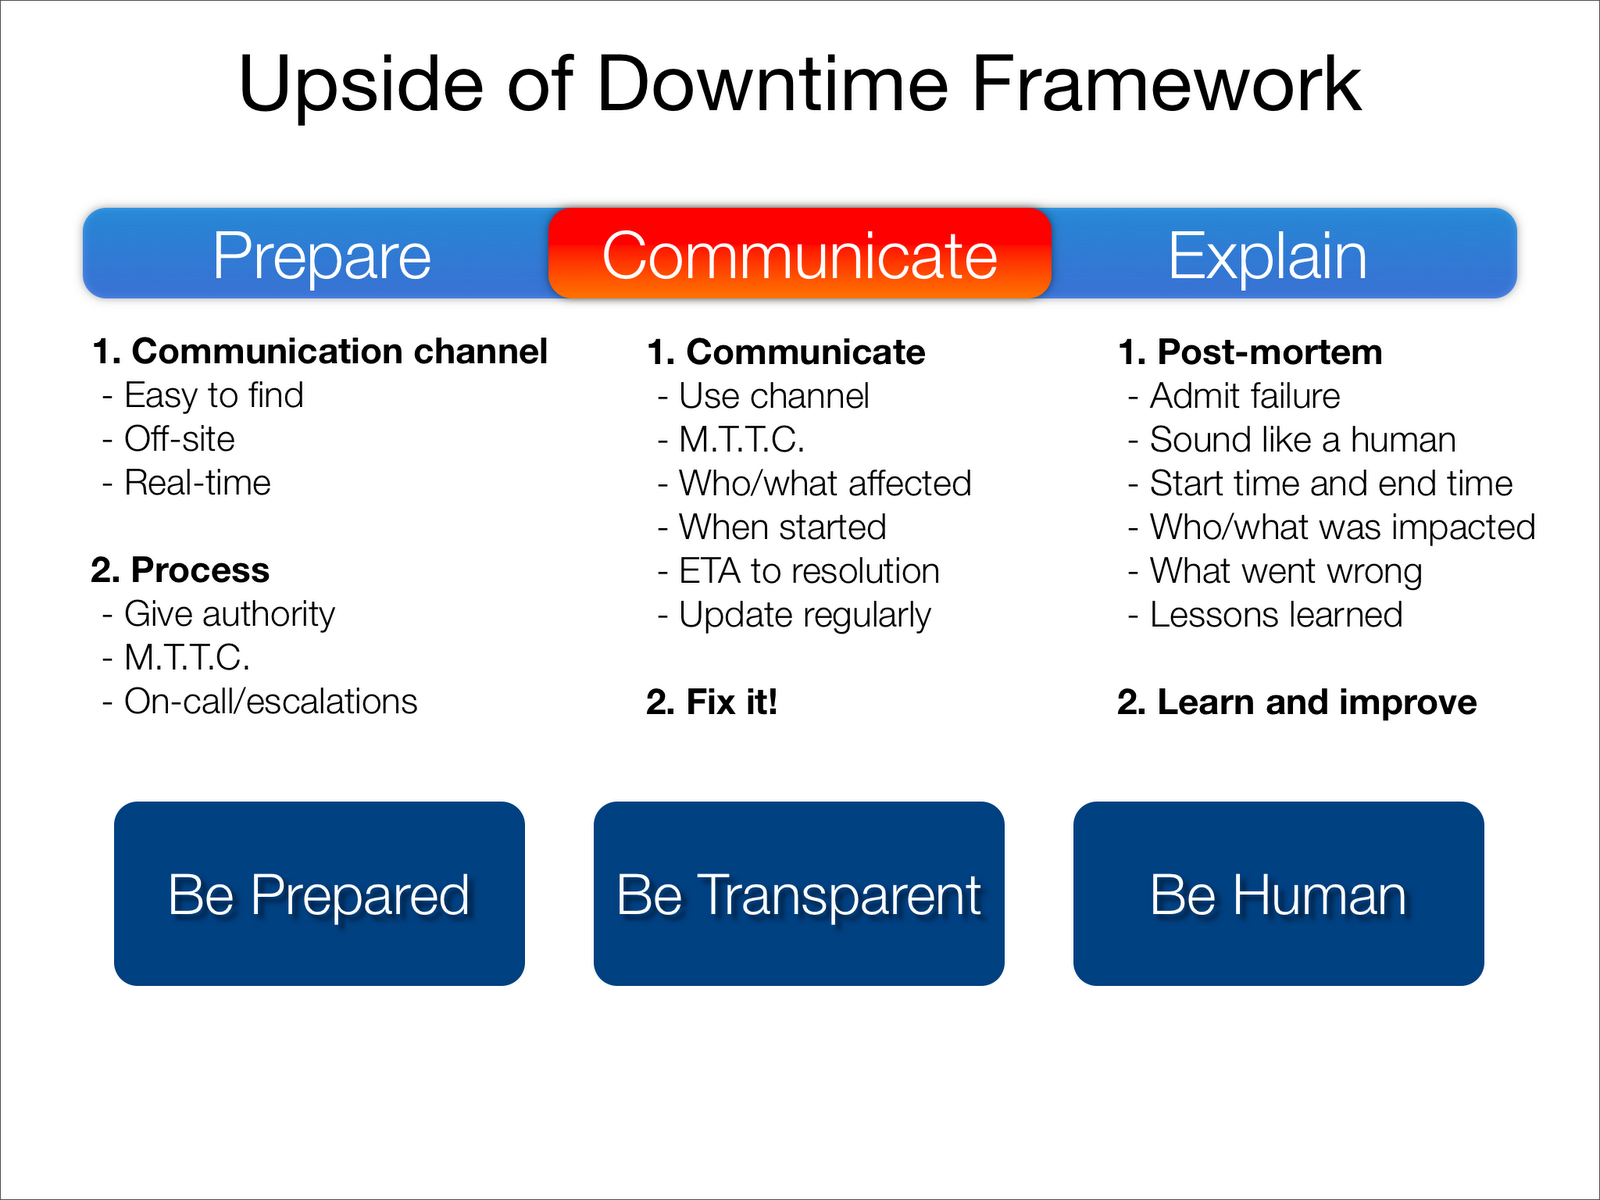
Along with this email, Atlassian went further and posted an extremely detailed postmortem of the entire event, detailing who was impacted, actions you need to take as a customer, lessons learned, and next steps that they are taking to improve for the future. Incidentally, this postmortem would fair very well if run through our postmortem best practices (even though the incident is completely different from a downtime event, for which the best practices were formed).

The Pay Off
Normally, an incident like this should create a large number of very unhappy customers. Instead, thanks to the quick, honest, and transparent response, we see the following reaction:


...and if you think I'm just picking out the positive reactions, compare a Twitter search for "Atlassian" with "positive" and "negative" sentiment. At the time of this writing, there are over 3 pages of positive results, and less than one page of negative (and many of the negative is unrelated to this incident). And this is after a major security breach.

Clearly a case of transparency turning a disaster into an opportunity, and how to take advantage of that opportunity by being open and honest with your users.

Friday, April 9, 2010

Your sites performance now affects your Google search ranking

Today Google officially followed up on a promise they made last year:
"Speeding up websites is important — not just to site owners, but to all Internet users. Faster sites create happy users and we've seen in our internal studies that when a site responds slowly, visitors spend less time there. But faster sites don't just improve user experience; recent data shows that improving site speed also reduces operating costs. Like us, our users place a lot of value in speed — that's why we've decided to take site speed into account in our search rankings. We use a variety of sources to determine the speed of a site relative to other sites."



If the ROI of page performance wasn't clear enough, we now have a big new reason to focus on optimizing performance. The big question is what Google considers "slow", and how search rankings are affected (e.g. are you boosted up if you are really fast, or are you pushed down if you are really slow, or both?). When are you done optimizing? Google has a big opportunity to set the bar, and give sites a clear target. Without that, the the impact of this move may not be as beneficial to the speed of the web as they hope.

What we know
  1. Site speed is taken "into account" in search rankings.
  2. "While site speed is a new signal, it doesn't carry as much weight as the relevance of a page".
  3. "Signal for site speed only applies for visitors searching in English on Google.com at this point".
  4. Google is tracking site speed using both the Googlebot crawler and the Google Toolbar passive performance stats.
  5. You can see what performance Google is recoding for your site (only from Google Toolbar data) in the Webmaster Tools, under "Labs"
  6. In the "Performance overview" graph, Google considers a load time over 1.5 seconds "slow".
  7. Google is taking speed very seriously. The faster the web gets, the better for them.
What we don't know
  1. What "slow" means, and at what point you are penalized (or rewarded).
  2. How much weight is given to the Googlebot stats versus the Google Toolbar stats.
  3. What Google considers "done" when a page loads (e.g. Load event, DOMComplete event, HTML download, above-the-fold load, etc.). Does Googlebot load images/objects, and if so does it use a realistic browser engine?
  4. How much historical data it looks at to determine your site speed, and how often it updates that data.
  5. Will there be any transparency into the penalties/rewards.
What I think
  1. Site performance is only going to play a factor when your site is extremely slow.
  2. Extremely slow sites will be pushed down in the rankings, but fast sites probably won't see a rise in the rankings.
  3. "Slow" is probably a high number, something like 10-20 seconds, and plays a bigger role in the final rankings as the speed gets slower. Regular sites won't be affected, even if they are subjectively slow.
  4. This is probably just the beginning, and we should expect tweaking of these metrics as we become more comfortable with them. We'll probably be seeing new metrics along the same lines in the coming years (e.g. geographical performance, Time-to-Interact versus onLoad, consistency versus average, reliability, etc.).

Tuesday, April 6, 2010

Zendesk - Transparency in action

A colleague pointed me to a simple postmortem written by the CEO of Zendesk, Mikkel Svane:
"Yesterday an unannounced DNS change apparently made our mail server go incognito to the rest of the world. The consequences of this came sneaking over night as the changes propagated through the DNS network. Whammy.

On top of this our upstream internet provider late last night PST (early morning CET) experienced a failure that prevented our servers from reaching external destinations. Web access was not affected but email, widget, targets, basically everything that relied on communication from our servers to the outside world were. Double whammy.

It took too long time to realize that we had two separate issues at hand. We kept focusing on the former as root cause for the latter. And it took unacceptably long to determine that we had a network outage."
How well does such an informal and simple postmortem stack up against the postmortem best practices? Let's find out:

Prerequisites:
  1. Admit failure - Yes, no question.
  2. Sound like a human - Yes, very much so.
  3. Have a communication channel - Yes, both the blog and the Twitter account.
  4. Above all else, be authentic - Yes, extremely authentic.
Requirements:
  1. Start time and end time of the incident - No.
  2. Who/what was impacted - Yes, though more detail would have been nice.
  3. What went wrong - Yes, well done.
  4. Lessons learned - Not much.
Bonus:
  1. Details on the technologies involved - No
  2. Answers to the Five Why's - No
  3. Human elements - Some
  4. What others can learn from this experience - Some
Conclusion:

The meat was definitely there. The biggest missing piece is insight into what lessons were learned and what is being done to improve for the future. Mikkel says that "We've learned an important lesson and will do our best to ensure that no 3rd parties can take us down like this again", but the specifics are lacking. The exact time of the start and end of the event would have been useful as well, for those companies wondering whether this explains their issues that day.

It's always impressive to see the CEO of a company put himself out there like this and admit failure. It is (naively) easier to pretend like everything is OK and hope the downtime blows over. In reality, getting out in front of the problem and being transparent, communicating during the downtime (in this case over Twitter), and after the event is over (in this postmortem), are the best things you can do to turn your disaster into an opportunity to increase customer trust.

As it happens, I will be speaking at the upcoming Velocity 2010 conference about this very topic!

Update: Zendesk has put out a more in-depth review of what happened, which includes everything that was missing from the original post (which as the CEO pointed out in the comments, was meant to be a quick update of what they knew at the time). This new post includes the time frame of the incident, details on what exactly went wrong with the technology, and most importantly lessons and takeaways to improve things for the future. Well done.

Thursday, March 18, 2010

Tuesday, March 16, 2010

How to Trust the Cloud

Next week I head off to Beijing, China to speak at Cloud Computing Congress China. Below is a sneak peek at the talk I plan to give (let me know what you think!):


Friday, March 5, 2010

Google App Engine downtime postmortem, nearly a perfect model for others

Google posted one of the most detailed and well thought out postmortems I've seen to explain what happened around their 2/24/10 App Engine Downtime. Let's run it through the gauntlet:

Prerequisites:
  1. Admit failure - Yes
  2. Sound like a human - Yes, more in some sections then others
  3. Have a communication channel - Yes, the Google App Engine Downtime Notify group. Ideally it would have been linked to from the App Engine System Status Dashboard as well.
  4. Above all else, be authentic - Yes
Requirements:
  1. Start time and end time of the incident - Yes, including GMT time, and a highly detailed timeline of the entire event
  2. Who/what was impacted - Partly, and also partly covered during the actual incident
  3. What went wrong - Yes, yes, and yes! Incredible amount of detail here.
  4. Lessons learned - Yes! Not only are there five specific action items, they are also introducing new architectural changes and customer choice as a result.
Bonus:
  1. Details on the technologies involved - Somewhat
  2. Answers to the Five Why's - No
  3. Human elements - heroic efforts, unfortunate coincidences, effective teamwork, etc - Partial
  4. What others can learn from this experience - Partial
Takeaways and thoughts:
  1. A vast majority of the issues were training related. This is an important lesson: all of the technology and process in the world won't help you if your on-call team is unaware of what to do. This is especially true during the stress of a large incident. Follow the advice of Google and run regular on-call drills (including rare issues), keep documentation updated, and give on-call people the authority to make decisions on the spot.
  2. Extremely impressed with the decision to use this opportunity to improve their service by giving their customers the choice between datastore performance and reliability. This is a perfect example of turning downtime into a positive.
  3. Interesting insight into their process of detecting an incident to communicating externally. From the start of the incident at 7:48am to the first external communication at 8:01am is not too shabby. Not sure why it took so long to post the update to the downtime forum and the health status dashboard (8:36am).
  4. The amount of time and thought that went into this postmortem shows how much Google is concerned about their service, and impressions around its reliability.
What could be improved:
  1. External communication could be faster. No reason not to post something as soon as the investigation begins, not to mention posting to the forum dedicated to downtime notifications and the health status dashboard immediately. When the incident started the dashboard had very limited data, which should be automatic and real-time.
  2. A post to this postmortem from the health status dashboard would make it a lot easier to find. I didn't see this until someone sent it to me.
  3. Timelines and concrete deliverables on the changes (e.g. on-call training sessions, documentation updates, new datastore feature release) would give us more confidence that things will actually change.

Wednesday, March 3, 2010

Cloud photos for presentations and documents

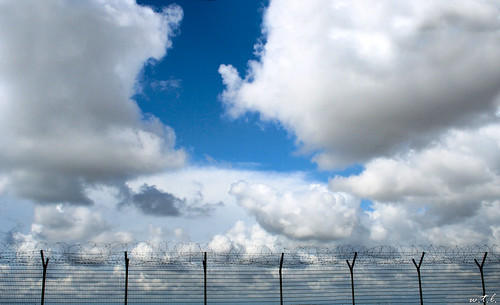
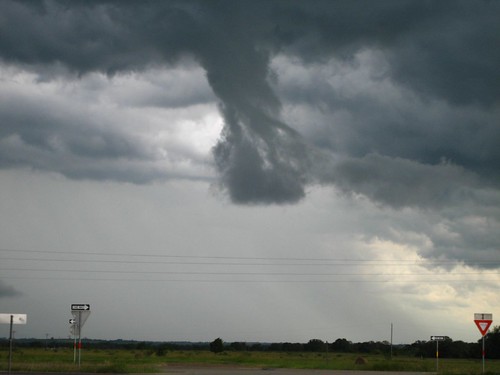
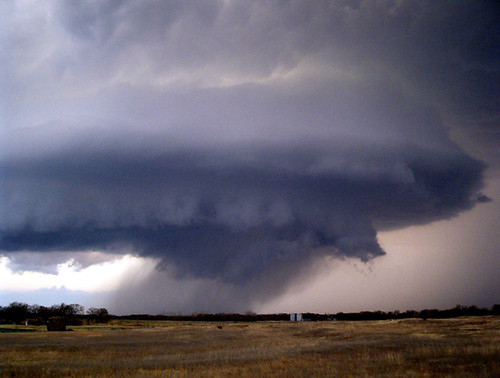
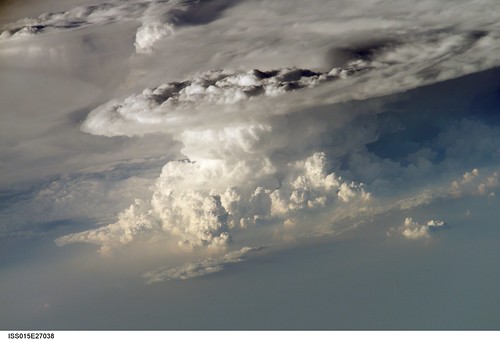
I've been working on a talk I'm giving at Cloud Computing Congress in China and (I'm not ashamed to admit) I spent a lot of time looking for just the right cloud photo. I thought I'd share the best photo's I came across, in case you ever need to give a talk about The Cloud (or just love photo's of clouds).

Note: These photos are all be licensed under Creative Commons, and came from a combination of Flickr Creative Commons search and Google Images (manually excluding non-Creative Commons images).

The photos are divided into four sections:
  1. Simple clouds

  2. Dark clouds

  3. Powerful clouds

  4. Unique clouds


Simple clouds

oct02cloud7aweb

195649679_6b66006d85_o

494749811_3407ce8489_o

425182690_0e8026ea85_b

Cloud_Queen

cloud-blue-sky3

clouds-blue-sky4

clouds-blue-sky2

cloud-blue-sky2

gray-clouds-blue-sky

cumulus-mountain-clouds

cloud-blue-sky2-1

195649679_6b66006d85_o

Some clouds for you


Dark clouds

265982218_0deaa583f0_o

2188831526_08c7d7f89a_o

fire-hole-sky

sea-storm-clouds

561660040_b6e795aeb3_o

476475563_74d547dbd6_o

clouds-evening-greys


Powerful clouds

sun_in_white_cloud-784254

Atlantic_cloud

CloudsSunRays

SunThroughCloud

sky3

169512408_83042be31e_o

2217512391_171170ddc7_o

2074716495_62a9a206b3_o

dark-clouds2

burning-evening-clouds

2625541464_a126c58750_b

silver-sunlit-clouds

3131005845_a2d6bc025b_o

bird-of-prey-sunrise

cloud-os-netbook


Unique clouds

Heart From Cloud-279799

xray-cloud-strands

gpw-20061021-NASA-ISS015-E-27038-huge-cloud-Earth-Pacific-Ocean-Chile-20070907-original


You can find all of these cloud photos here. If you have other favorites and are willing to share, please add a link to them in the comments.